


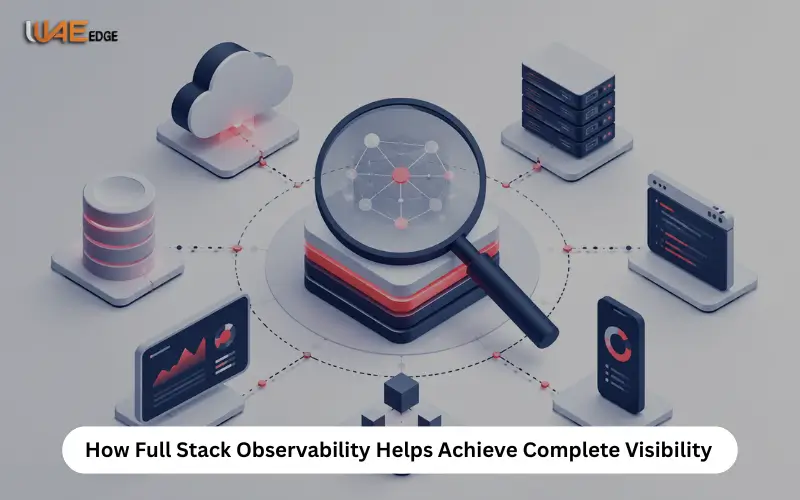
The modern enterprise technology stack is not a predetermined system. Apps operate on hybrid cloud; microservices connect across dozens of containers and users simultaneously use dozens of apps across multiple platforms. In such an environment, being “up” isn’t enough to know that a server is up. Teams should be aware of why it’s slow, which service caused a regression, and the on-the-ground impact on the end-user of a transactional degradation on the backend.
Where full stack observability comes into the picture when that is the case. Insights into what that translates to in everyday practice, why it opens up new perspectives on monitoring and what business opportunities arise when you see through all your blind spots are removed.
What is Full Stack Observability?
Full-stack observability to understand internal system state by analysing all the data it constantly generates. The data can be one of 3 main types: logs, metrics and traces.
- Logs are a record of individual events that happen.
- Metrics monitor a number of entities over time, such as CPU usage or requests.
- Traces run throughout a single transaction, as it moves from the first API call through every stage of the transaction up to the last writing to the database.
By consolidating these three types of signals in a single platform and managing them, operation & engineering teams transition from alert response to issue detection. Organisations with full stack observability cost $1M per high-impact outage on average, half of the $2M median high-impact outage cost for those without full stack observability, according to a New Relic 2025 observability survey.
How Traditional Monitoring Creates Blind Spots
Traditional monitoring tools designed for predictable server-to-server-based infrastructure. They operate based on predefined metrics with alerts to be triggered when the metrics cross the set thresholds. The alert triggers when a server is running hot or when a service goes down, and a team rushes to respond. This model has a major drawback – it only identifies failures it was designed to respond to a specific type of failure.
Most impactful failures in a distributed & cloud native setup are not single-point failures. They arise in an interaction of several systems on layers. If a container is misconfigured, there may be latency in the API that is located upstream, delaying the checkout process for users, thus affecting the conversion rate. None of the individual threshold alarms is sensitive to that sequence of events.
A survey taken by New Relic in conjunction with Enterprise Technology Research finds that almost 75% of IT and engineering organisations are stumbling on full-stack observability. Many use 4-6 isolated monitoring tools that record a part of the environment. The repercussions are all around in incident timelines – long delays in achieving root cause analysis, alert overload, missing items in a technology avalanche.
How Full Stack Observability Achieves Complete Digital Visibility
The shift to full-stack observability from scattered monitoring is around a structured architectural pattern. Let’s see how each layer contributes to providing end-to-end digital visibility.
Unified Data Collection
It collects Logs, Metrics and Traces from all layers (Apps, DBs, Network), using a standard structure.
Cross-Layer Correlation
Data signals are automatically connected with layers. Application error rates can easily go up if the database query regresses or if some pod in the Kubernetes rehydration reloads within seconds.
Centralized Platform
All data is collected in one place on a single dashboard. This enables developers, operations and security analysts to have the same source of truth.
AI-Powered Anomaly Detection
Baseline behavior models and surface deviations from behavior are set by machine learning before outages.
User Experience Monitoring
To provide end-to-end coverage, a mix of frontend data like page loading times, API response rate and session-level error rate is combined with backend signals.
Intelligent Alerting
Enabling context-aware alerting means eradicating noise, sending the message to the right team, and decreasing the mean time to detect (MTD) substantially throughout all engine’s layers.
Key Business Outcomes of Full Stack Observability
The use of the operational benefits results in tangible business results. It’s no longer beneficial for any company where digital uptime, performance, and user experience equate to revenue. In enterprise (on-premises) deployments, three things come through loud and clear:
- Faster Incident Resolution: Connected telemetry provides quicker Incident Resolution. As long as every layer is clearly visible and team data can be correlated, teams solve incidents in minutes and not hours.
- Better Compliance: Centralized log management and audit trails, along with compliance reporting, simplify BFSI and healthcare industries’ compliance management needs in one location.
- Lower Total Cost of Operations: Reduce TCO: It eliminates licensing overheads and diminishes the engineering effort involved with switching between dashboards.
The full-stack observability services market is expected to grow to USD 60.29 billion over the forecast period at a CAGR of 22.37%, indicating the need for enterprises to have a comprehensive digital perspective, according to the report by Market Research Future.
What To Look for in a Full Stack Observability Platform
As crucial as the decision to invest in “full stack observability” is the choice of platform. It verifies platform’s promises:
- Breadth of Signal Coverage: The platform should support native ingestion of logs, metrics, traces and user quality and experience data, avoiding the need for a separate application for each type of signal.
- OpenTelemetry Compatibility: Vendor-neutral instrumentation minimizes lock-in and integration into existing infrastructure.
- AI-Assisted Root Cause Analysis: engineering teams will see an automatic process that correlates and identifies an anomaly, reducing the manual load on them.
- Scalability: Ability to scale to accommodate a growing amount of data without delay or unpredictable cost increases based on the environment.
Conclusion
Adding more of these monitoring tools does not equal complete digital visibility. It needs to be a consolidated architecture that gathers all signals including infrastructure signals as well as user session data and correlates and surfaces them in real-time. That is feasible thanks to full-stack observability. Those organisations that do work more efficiently by reducing the time spent on resolving incidents establish a higher level of compliance and respond more effectively to increased complexities in their digital environment.
Compliance requires you to have full-stack observability solutions — CyberNX can help you with them. The team brings together skills in the area of Elastic Stack, enterprise observability platforms and security integration to provide full digital visibility at day one. When you’re prepared to take monitoring to the next level, speak with the CyberNX experts and check out the complete stack of observability solutions designed for your environment.
Also read: Jumbo Electronics Head Office


